Building a Web Performance Culture
By Greg Heidorn
It’s easy for a website’s performance to degrade over time. Trying to keep up with the competition through innovation rarely affords the time to tune and optimize and, often times, organizations struggle with balancing performance technical debt with their day-to-day operations. At some point, a business will realize that neglecting performance is impacting the bottom line negatively in some way. When that happens, what do you do? At Cars.com, we developed a strategy that focuses on building a web performance culture that would sustain itself over time.
Existing Challenges
There were several challenges that lead us to address our performance issues. First and foremost, the site felt slow. The page would load in chunks, with different content arriving at different times, and the spinner on the browser tabs seemed to always be rotating. We knew that there were a few reasons for this behavior: inefficiencies in our codebase, our advertising calls, and our third-party tags. Confirming what we felt, we intermittently received feedback from our users that both our desktop and mobile experiences were sluggish.
How did we get to this point? Well, in the past we never set any goals or standards for performance. There would be the occasional “performance blitz” where we’d spend a week focused on low-hanging fruit. But months or years later, the same issues would creep back into our products. We needed to define some clear standards for the performance our website.
There would be the occasional “performance blitz” where we’d spend a week focused on low-hanging fruit.
Without goals or standards, we had no way to communicate how our performance was impacting our users. Our product teams didn’t have any metrics from which they could make informed decisions about balancing time spent on performance versus features. There was no evangelism about why performance is important and developers weren’t afforded the time to make improvements on their own. As an organization, we couldn’t speak a common language of web performance, which led to burying any optimizations on the priority list.
As most developers know, 80% or more of a page’s load time is spent on the client.
There were two key gaps in our tool chain: benchmarking and real-user monitoring. What made most of these challenges difficult was the fact that we were using inaccurate and dated tooling to report on web performance. We used outdated methods to determine what was fast or slow, and our tooling was designed for the server-side than the client-side. As most developers know, 80% or more of a page’s load time is spent on the client.
Where Do We Start?
We started our journey by identifying goals and how to measure them. We read articles about how Amazon translates latency to dollars lost, but we don’t have the same business model. We thought about our KPIs — Traffic, Bounce Rate, Time Spent on Site, and Consumer Leads — how are they impacted by performance? To find out, we needed data that correlates any of these KPIs with the user experience.
Enter Real-User Monitoring
We enabled DynaTrace UEM as a RUM tool on our website that anonymously captures information about each of our user’s interactions: number of clicks, which links were used, what actions were take, and what paths they chose. As it captured this information, it also measured the time each interaction took and labeled the experience with the following terms: Satisfied, Tolerating, or Frustrated. Out of the box, UEM measures a Satisfied action as occurring under four seconds, a Tolerating action between four and 16 seconds, and a Frustrated action as taking longer than 16 seconds.
With DynaTrace UEM, we could now measure how Bounce Rates increased or decreased based on the quality of the user experience. We soon learned that there was definitely a correlation between the user’s experience and Bounce Rate. The following chart shows our Bounce Rates for Mobile Users based on their User Experience.

As you might expect, a worse experience will produce a higher Bounce Rate. Similarly for the Desktop, we see the same pattern, as seen in the next chart.
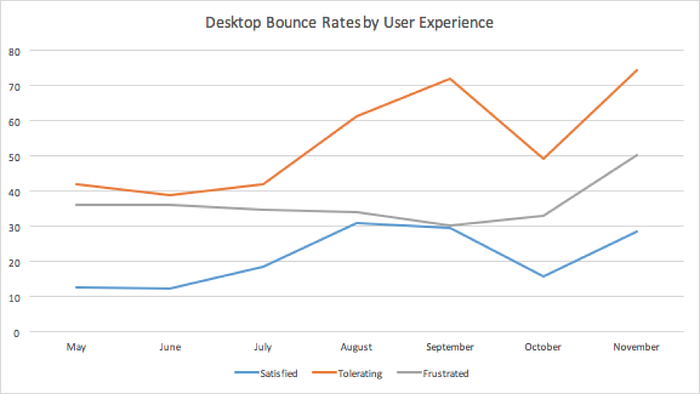
With our hypothesis supported by data, we were now able to set a goal of increasing the number of Satisfied users and reducing the number of Tolerating and Frustrated users.
Preparing a Performance Initiative
Now that we were armed with a goal, we needed to identify the steps to take. In order to make this effort achievable, we decided to focus on the core three pages of our website: Home page, Search Results page, and Vehicle Details page. Focusing on these three allowed us to drive deep into the codebase, limit the scope of the effort, and provide the largest lift for the business.
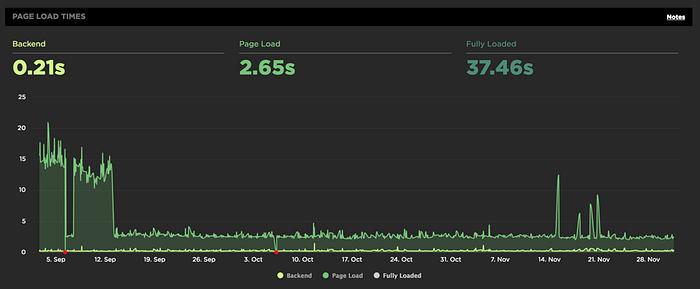
Next, we needed to understand which Performance KPIs were important and how our existing application measured up. We used WebPageTest to set up a baseline of metrics from which we could start iterating on. However, running WebPageTest and capturing those result became a repetitive, mundane process; we needed a benchmarking tool that would do this for us. Thankfully, there is a great product on the market called SpeedCurve that does just that.
SpeedCurve enables you set up tests to run periodically and provides a simple interface to quickly see whether your site is getting better or worse. SpeedCurve leverages industry standard KPIs such as Time to First Byte, Start Render, Page Load, and Page Fully Loaded to provide consistent insight into page performance.
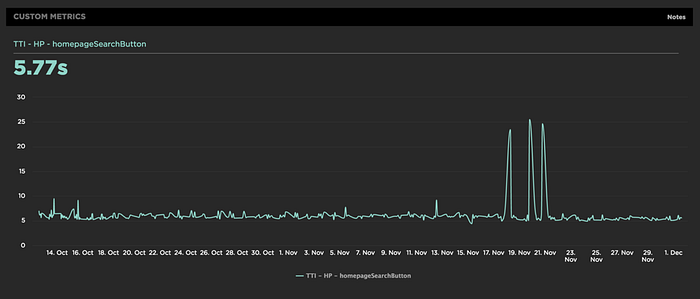
SpeedCurve also allowed us to implement our own “Time to Interact” (TTI) values, which were implemented into the page using the W3C User Timing specification. WebPageTest supports the capture of marks created using this API, and SpeedCurve built this into their dashboard support to make it easy to see how you’re doing.
In addition, SpeedCurve provides Performance Audits of pages that are performed by industry expert Steve Souders. We found these invaluable for both identifying new techniques and confirming our suspicions about how to improve page performance.
Now that we had a goal, a target product, and a way to measure our progress, we just needed to communicate our purpose to the organization and earn support from our leadership.
Preparing the Organization
Once we were able to implement SpeedCurve to provide us with information on how the site was performing, the next step was to evangelize the positive and negative as we released code. We were able to quickly identify the impact of releases across our many product teams and we prepared a weekly status report that would include the highlights (and lowlights).
Now that we could quickly identify improvements and degradations, we circulated them to everyone who would listen. We prepared decks and evangelized the importance of speed and how we could improve our Product metrics by focusing on best practices and recommendations from SpeedCurve. Eventually, we were able to convince Cars.com leadership that they would see business gains from our performance improvement plan.
We tried several approaches to delivering performance improvements over the course of the year. Product teams tried to add stories to their backlog and work on them when there were lulls in feature delivery. Architects tried to leverage Akamai tools to improve performance without having to touch the code. We finally created a dedicated Team Speed under a Lean Agile model to deliver a simple goal of a 1.5s Time to Paint for our targeted pages. Over the course of the year (and through all of these different avenues of changes), we were able to deliver significant performance improvements — the key ones I will review in another blog posting.
Arriving At Our Destination
To recap, we had four key challenges that needed to be addressed:
- Perceived Slowness
2. Lack of Goals and Standards
3. Lack of Communication
4. Lack of Tooling
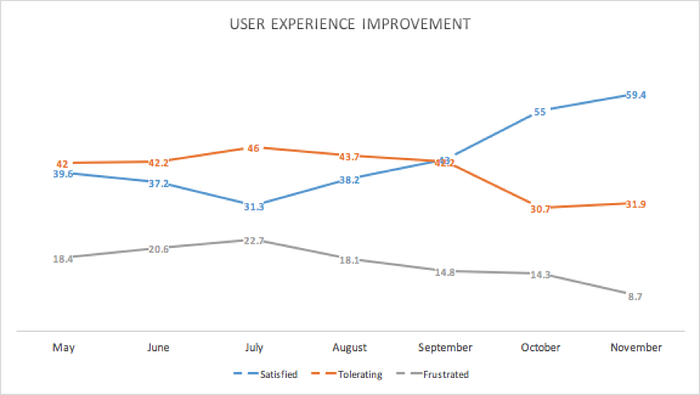
We leveraged Real-User Monitoring to derive goals and standards that could be benchmarked by SpeedCurve. We enabled the organization to understand what our performance was, and how it was changing on a weekly basis. We earned buy-in from multiple areas and levels of management team at Cars.com to address the perceived slowness and bring about change that impacted business KPIs of Bounce Rate.
The following chart shows how our performance efforts this year have increased the percentage of satisfied experiences and decreased both the number of tolerating and frustrated experiences.
What Lies Ahead
Having reached the summit of our adventure, what remains is how to maintain our success. We feel there needs to be some inherent KPI or budget of page speed that will ensure we never let our pages slip into poor performance again. Determining what those numbers are, however, is a difficult task that is currently under investigation.
We are developing a part of our CI/CD pipeline to perform WebPageTests during the build process that can be compared and developers can be alerted when performance deviates too far during the product lifecycle, before the code hits production.
Having reached the summit of our adventure, what remains is how to maintain our success.
Combining those two efforts with our work in benchmarking, we feel that our Performance Strategy can be maintained and successful for years to come.

